Graphs and Plots in Matlab

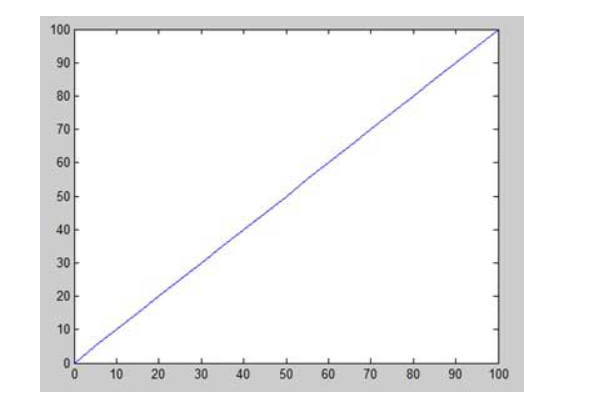
To plot the graph of a function, you need to take the following steps − Define x , by specifying the range of values for the variable x , for which the function is to be plotted Define the function, y = f(x) Call the plot command, as plot(x, y) Following example would demonstrate the concept. Let us plot the simple function y = x for the range of values for x from 0 to 100, with an increment of 5. Create a script file and type the following code x = [ 0 : 5 : 100 ]; y = x ; plot ( x , y ) When you run the file, MATLAB displays the following plot − Let us take one more example to plot the function y = x 2 . In this example, we will draw two graphs with the same function, but in second time, we will reduce the value of increment. Please note that as we decrease the increment, the graph becomes smoother. Create a script file and type the following code − x = [ 1 2 3 4 5 6 7 8 9 10 ]; x = [- 100 : 20 :...