Posts

Graphs and Plots in Matlab
Image
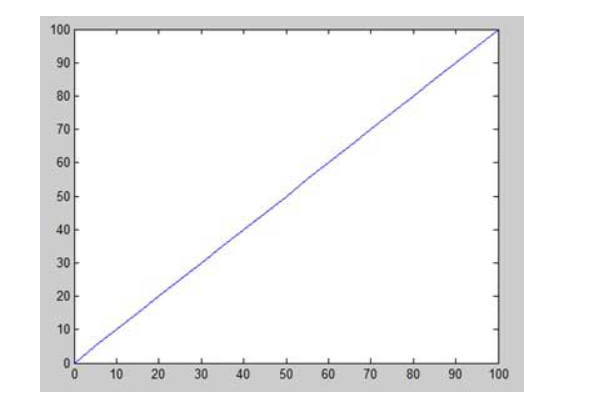
  To plot the graph of a function, you need to take the following steps − Define  x , by specifying the  range of values  for the variable  x , for which the function is to be plotted Define the function,  y = f(x) Call the  plot  command, as  plot(x, y) Following example would demonstrate the concept. Let us plot the simple function  y = x  for the range of values for x from 0 to 100, with an increment of 5. Create a script file and type the following code  x = [ 0 : 5 : 100 ]; y = x ; plot ( x , y ) When you run the file, MATLAB displays the following plot − Let us take one more example to plot the function y = x 2 . In this example, we will draw two graphs with the same function, but in second time, we will reduce the value of increment. Please note that as we decrease the increment, the graph becomes smoother. Create a script file and type the following code − x = [ 1 2 3 4 5 6 7 8 9 10 ]; x = [- 100 : 20 :...

Data Types in Matlab

  MATLAB does not require any type declaration or dimension statements. Whenever MATLAB encounters a new variable name, it creates the variable and allocates appropriate memory space. If the variable already exists, then MATLAB replaces the original content with new content and allocates new storage space, where necessary. For example, Total = 42 The above statement creates a 1-by-1 matrix named 'Total' and stores the value 42 in it. Data Types Available in MATLAB MATLAB provides 15 fundamental data types. Every data type stores data that is in the form of a matrix or array. The size of this matrix or array is a minimum of 0-by-0 and this can grow up to a matrix or array of any size. The following table shows the most commonly used data types in MATLAB − Sr.No. Data Type & Description 1 int8 8-bit signed integer 2 uint8 8-bit unsigned integer 3 int16 16-bit signed integer 4 uint16 16-bit unsigned integer 5 int32 6 uint32 32-bit unsigned integer 7 int64 64-bit signed integer...